
How to Value a Home: Karl on why renters are shunted and the latest on derivatives by Renegadeeconomists on Mixcloud
Renegade Economists podcast 358
As broadcast on 3CR, Wed 17th September, 2014.
Subscribe to the world’s only weekly podcast on our earth rights.
How to Value a House show notes
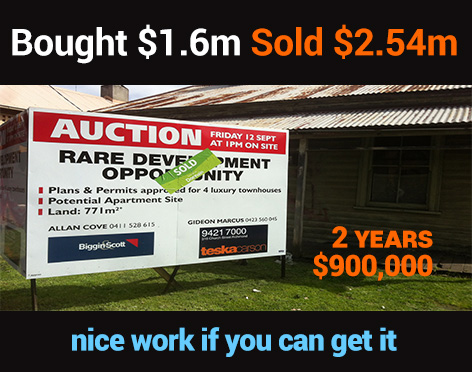
336 Burnley St, Richmond. High profile, high profits, $900K in 2 years – nice work if you can get it. Obviously been vacant for years. 1971 calendar covered in cobwebs. View the news story. Summed up in this facebook poster:
Have u ever wondered why renters get pushed out of a property when a property goes to auction?
Its essentially an admission that the new rental price demanded to meet the auction price paid will be above and beyond what the current renter has paid in the past.
Take the case of our colleague, Mr X, who has been living innner melbourne house for a decade. He started off paying $1000 p/m. For the last few years that increased to $1300. Remember the formula for valuing a house:
Monthly rent x 12 months x 20 years
$1300 x 12 months x 20 years = $312,000
Mr X has paid about $150 k over the last 10 years, about half what the place was bought for.
Recent sales in the area indicate this run down property will sell for $700K.
$2916 p/m v $1300 p/m = more than double in rents required to justify the expected price.
Investors have the ability to rent at a discount to this $2,916 because of negative gearing. The more investors lose on the property, the less they pay in tax. Nice incentives eh? They also understand they will enjoy a capital gain in years to come, making up for any short term losses. Read Philip Soos on just how much these negative gearing losses add up to.
Conservative commentators talking bubbles:
David Gonski
Peter Costell – running out of luck
Investors half of all housing loans
However, if you exclude refinance of existing loans, then a staggering 50% (rounded up) were for investment purposes. This is an absolute record, and represents a 4% uplift from last month. …. The attraction of lifting house prices and low interest rates make property investment for many compelling.
Derivatives and Australian housing
5232.0.55.001 – Assets and Liabilities of Australian Securitisers, Jun 2014
At 30 June 2014, total assets of Australian securitisers were $131.3b, up $2.5b (2.0%) on 31 March 2014.
That equates to 8% for the year.
are debt securities backed by cash flows from mortgages or public sector loans. They are similar in many ways to asset-backed securities created in securitization, but covered bond assets remain on the issuer’s consolidated balance sheet (usually with an appropriate capital charge). The covered bonds continue as obligations of the issuer (often a bank); in essence, the investor has recourse against the issuer and the collateral, sometimes known as “dual recourse.”[1] However, there exist other variable types where assets come off balance sheet. As of 2012 volume of outstanding covered bonds worldwide was euro2,813 billion, while largest markets were Germany (€525 bil.), Spain (€440 bil.), Denmark (€366 bil.) and France (€362 bil.).[2]
ABS rank Covered bonds as ‘Other’ according to the relevant statistical department. These were listed at $22bn Mar 08 down to $1.3bn June 2013. The last few months they were not reported as volumes were so low. But then we come across this article.